

One of the parts in After Effects that might make beginners scratch their heads is the graph editor, especially when trying to figure out the difference between the Speed Graph and the Value Graph. They might look similar, but they do very different things. Let’s break them down in simple terms so you can get the most out of them.
What’s the Big Deal with Speed and Value?
Speed Graph
Think of this graph as showing the “speed” of action. It doesn’t tell you where something is, but how fast it’s moving. Like when you’re on a bike – it’s not about how far you’ve gone, but how fast you’re pedaling.
Value Graph
This one is about the “where”. It tells you the actual position or value of something over time. Going back to our bike example, this would be the distance you’ve traveled.
Getting a clearer picture
Seeing Speed and Value in Action

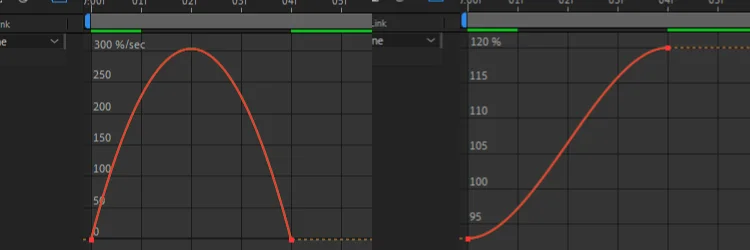
Speed Graph: With a ball bouncing up and down, the Speed Graph peaks (or goes up) when the ball hits the ground (because it’s moving fast) and flattens out (or goes to zero) when the ball is in the air and starts to slow down.
Value Graph: On this graph, you’ll see the height of the ball. The higher the curve, the higher the ball is in the air. When the ball touches the ground, the curve flattens out.
Tweaking your animation
Both graphs have these handles that you can pull and push. Moving these around changes the way your animation looks.
Speed Graph: Pulling the handles around here will make your animation faster or slower. It’s like adjusting how quickly or slowly you want the action to happen.
Value Graph: When you move the handles on this graph, you’re changing the timing on when the action takes place. Like deciding how high or low something should go.
Which one to use
Speed Graph: If you want to play around with how fast something happens, like a rocket shooting up into the sky, this graph’s your go-to.
Value Graph: If you want to decide when something should be happening or how it changes, like making a light bulb change colors, stick with this one. Value is also often used in edits.
Wrapping Up
The Speed and Value Graphs in After Effects are like tools in a toolbox. They each have their own job. And once you get the hang of them, you’ll see how cool and useful they can be. Remember, it’s all about practice. The more you play around with these graphs, the better your animations will look. So go on, give them a try and have fun animating!

AHRevolvers
Adding onto what aenoiia said, if you’ve taken any physics or college math before the velocity graph is the derivative of the speed graph. The first pic shows this best- the left graph is nearly identical to y=x^2, and the right graph is approximately y=2x. If you remember position/velocity/acceleration in physics, this is exactly the same thing except we call it speed instead of position. That was something that helped connect the dots for me when learning speed graphs.
aenoiia
Nice article! I also like to think of it like this:
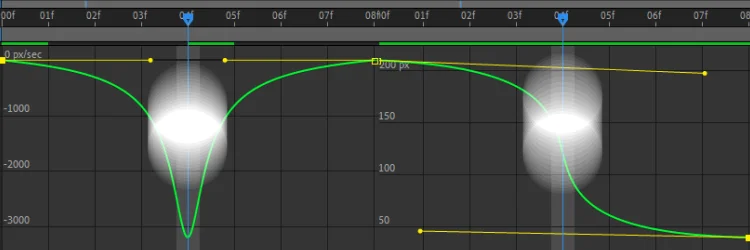
The speed graph is basically a velocity v. time graph where the x-axis represents the composition time and the y-axis represents the object’s velocity.
The value graph is essentially a position v. time graph where the x-axis represents the composition time and the y-axis represents the object’s position VALUE. The slope of this graph is the object’s velocity so as you see in the first graphic of the value graph, the slope of the graph is small so the object’s velocity at that time is slower, but as time passes, the slope of the graph becomes steeper, indicating that the object’s velocity increases.
Effects Collective
We’re glad you like it!